There can only be one…

memorial

Back in May, Kansas City sat in fourth place. They played two to four games more than everyone else. On the surface the team looked like they were in trouble. However their extremely high TSR and extremely PDO made them the best candidate to challenge Seattle. Fast forward and they have finished 2nd in the league and are now traveling to Seattle to try to bring back a championship back to Kansas City. These stats may not predict the future but they are valuable pieces of information.         

Stats from the Regular Season

Stats from the Regular Season

Screen Shot 2014-08-29 at 1.08.27 AM

Stats aren’t perfect, but they are pretty good. Seattle as the most dominant statistical team and deserve to be in the final. And while Kansas City has had some ups and downs, their TSR has been consistently one of the top two or three in the league and also they deserves to be there. The two teams dominate their opponents TSR perspective, Seattle has a TSR of .60 and Kansas City has a TSR of .55. Making them the number one and three TSR in the league. Both teams consistently outshoot their opponent, which is not surprising for those that have watched the two teams play. For example in last week’s play off game, Kansas City outshot Portland 15-5. While there has been a lot of talk about the heat, both teams played in it and Kansas City dominated the number 3 team. Seattle playing in what seemed like a cool night outshot Washington 17-8. Both of these teams dominated not just random teams in the league, but did this in play off games, which only shows how dominant these teams are.
To me, a team’s past PDO isn’t as impactful in a one off game. I think that it indicates future trends and understanding the past body of work by giving context than being helpful in predicting one off games. That being said, Seattle has a crazy high PDO. They’re really optimizing everything because they convert the most shots on target into goals, and prevent the most shots on target from becoming goals. All year, I’ve been wondering how much of this is their system and personnel. For example all year they’ve consistently had the highest save percentage, the easy place to look is that they have Hope Solo who saves 78%. But in 4 games back up goalie Haley Kopmeyer saved also nearly 90% of shots on goal too.

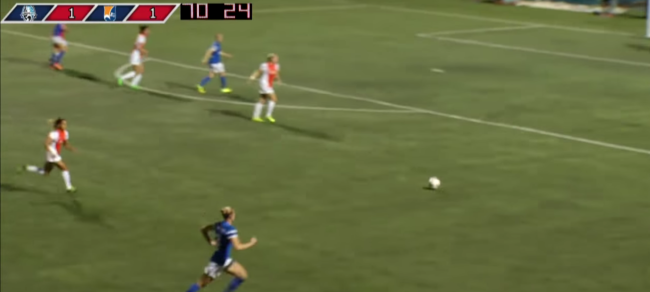
This match up though, is as much about the coaching as it is the players on the field. Both teams to me are successful because of their high press. They are both quick to press the ball. This was exemplified by Megan Rapinoe’s goal for Seattle. Seattle’s shape and organization, is what leads to the turnover and goal.

Not only is Rapinoe pressing the ball 40 yards from goal, (thank you football lines) but LeRoux up top and Naho are in position to press the pass while Little is able to block the two central passing lanes with her body. This forces Pressly to take a few extra touches, leading to a turnover and eventual goal.

Not only is Rapinoe pressing the ball 40 yards from goal, (thank you football lines) but Leroux up top and Naho are in position to press the pass while Little is able to block the two central passing lanes with her body. This forces Pressly to take a few extra touches, leading to a turnover and eventual goal.

This team goal, is an example of the coaching from Laura Harvey, turning last year’s third worse defense to the league’s best defense. If one of the players is not in position that Pressly has an easy outlet and nothing happens. On the other side Kansas City head coach, Vlatko Andonovski, showed his tactical acumen by shutting down the admittedly scary Portland defense. Instead of trying to shut down the offensive juggernaut that is Portland’s attack, Andonovski shut down the distribution to the front line. Doing so he was able to shut down Portland and limit them to four shots with only one of them on goal.

Another testament to the coaching is the numbers of fouls committed. Originally I was looking for stats that would prove their both team’s pressing, which would ideally have been tackles. Upon finding that the league doesn’t keep track of that I decided to look at fouls. I thought that with both team’s constant pressing that the number of fouls committed would be high, however these two teams had by far, the least amount of fouls in the league. This comes down, for me two things. First off that both teams have so much of the ball that they don’t have a chance to commit fouls. Combining their high TSRs, which we are substituting for possession stat because it doesn’t exist for NWSL, and the low number of fouls committed by both teams, we see from another perspective how dominant they are. Essentially they don’t have a chance to foul the other team. But even more impressive is that because of how well organized that they aren’t forced to resort to fouling either. Fouls are more likely to be called because the player is taking a chance trying to get the ball or out of position. Look again at the Rapinoe goal. The team is so well organized that none of them are in positions that they will be forced to commit fouls or allow a counter.

When matching up against each other the two teams are fairly even. Seattle won the regular season series, winning the first match up and tying the last 2. Seattle only shot the ball 2 more times than Kansas City (33-31), making the TSR between the two virtual identical of .51 for Seattle and .49 for Kansas City. While both teams are used to outshooting their opponent, here Seattle’s freakishly efficiency and PDO might come in handy as they are able to make more of their limited chances. Stats wise I give a slight edge to Seattle.

Kim Little and Amy Rodriguez. This season we have watched them both race for the Golden Boot, and now we are going to watch them take each other on for the trophy that they most likely want more. To me these two players, specifically how they’ve performed represent what the teams need to do.

Amy Rodriguez leads the league in goals from open play with 13 non-penalty goals. Will she be the key for Kansas City to upset Seattle?

Amy Rodriguez leads the league in goals from open play with 13 non-penalty goals. Will she be the key for Kansas City to upset Seattle?

For Seattle the defense needs to be their focus. Last game, Seattle only gave up 8 shots, which is a good number. The problem with the eight shots they gave up is that seven of them were on target. A-Rod has already shown that she can take advantage of such chances, scoring thirteen non-penalty goals this year.Seattle needs to be very careful in dealing with chances they give up as she has already scored two against them from the run of play and drew a penalty as well. Seattle last week looked vulnerable, and was a Hope Solo penalty save away from going down 2-1 with about 15 minutes left to play.

Last week I wrote about how Kansas City needed to limit their mental mistakes to advance past Portland. I wrote about how they only gave up five penalties all year this year. While two of those were to Portland, another two of them were to Seattle. Kansas City collectively saw first hand what Kim Little does from the spot, which is score goals. Little won the Golden Boot with 16 goals, a big part in thanks to how she performed from the spot, where she was a perfect six for six. Washington was able to keep Little silent for the most part last week, and it will be interesting to see what Andonovski does to handle Little, seeing as he has been successful so far this year.

The game itself will be played in front of a sold out field at Starfire. While Seattle so far this year has won all of the individual awards, Golden Boot, MVP, and Coach of the Year, Kansas City comes into this game with a shot at taking home the trophy that means the most so far in the NWSL, the Championship. Tune in to ESPN2 on Sunday at 3 pm EST. If you have any question or comments tweet me @Huanandonly or email me at Huan246@gmail.com . Thank you for reading!

Playoff Preview Number 2

The other day I did a preview of the highly anticipated match up between Kansas City and Portland. Today I’m going to be looking at Seattle and Washington. Once again I’m going to be looking at this mostly from a stats based point of view. For a refresher you can look at Richard Whittall’s primer here. TSR is the ratio of how many shots you take vs. how many you give up, .50 would be taking and giving the same amount of shots. PDO a metric that is measures a team’s luck. It does this by combining save percentage and shot percentage, both of which are highly volatile and most often quickly regress to their mean.

Match-up may seem closer than it appears.

Match-up may be closer than it appears.

Looking at Seattle, there is only one thing to say about them. Simply the best. They locked up the regular season title absurdly early, failed to win on only 8 occasions, had the highest TSR (.60) in the league, the highest shot conversion percentage, the highest save percentage, and therefore also the league’s highest PDO. On the other hand Washington, despite finishing fourth, pales in comparison. Its TSR is only better than two teams, Boston and Houston (who were the two worst teams in the league), at .46. With a TSR that low and the fact that they finished in fourth place you would expect their PDO to be high, but it is actually slightly below the league average at 986. Washington not only failed to control the games but they were, from a statistical standpoint, not exactly lucky either. In fact, for all their goalie Ashyln Harris has brought to the team this year, they also had the league’s 2nd worse save percentage. Meaning they not only gave up a lot of shots, but the ones on target also had a high chance of going in. Looking simply at these numbers, Seattle has the edge. They not only dominate the game, with an absurdly high TSR, they are also extremely efficient and playing with luck on their side. Seattle seemingly did everything right this year to put them in a place to win.

While Seattle was a highly dominant outfit throughout the year, how did Washington make the playoffs with such a low TSR and average luck? 9 out of 10 of the team’s wins came by one goal; their only multi-goal win was against Kansas City in their second win of the year. That would explain how the Spirit were able to make it through with not only a weak TSR and PDO but also a goal differential of -7. While this may be a bad sign about Washington’s ability to repeat this season’s success (goal differential statistically has been proven to be another indicator of future performance) it may be good for their playoff run, their success in close games shows that they have experience playing in and winning close games.

The season series between the two, Seattle out scored Washington 6-3, and out shot them 40-17. Washington though in their last match up was 2 minutes and stoppage time away from beating Seattle 1-0. While the stats themselves give Seattle a lead, in a one off game anything is possible. Washington has lead the series twice, while they gave up the lead in both situations, it shows that they aren’t scared of Seattle. The problem is that both times they have given up that lead, and Seattle has proven that they are a team that can play from behind.

From a season long statistical point of view, I don’t think that there is a lot going for Washington. However in a one off game, I think Washington probably has a better shot than the statistics suggest and could surprise people, especially after watching their last game against Seattle. Remember to tune in on ESPN2 at 3 pm EST on Sunday

Playoff Preview Number 1

First off, it is time to throw the stats out the window. Statistics and analytics are a good for predicting outcomes over a long period of time, for example the teams with the top 3 TSR’s are in the playoffs.

What they’re not good is one off results. For example, Seattle has only dropped points on 8 occasions all year. Which shows their dominance, however half of those dropped points came against teams that didn’t make the playoffs. If you flip a coin enough times you’ll get to 50%, but that doesn’t help you predict what’s coming next.

Can the defending champs do it again?

Can the defending champs do it again?

This match up is by far the more intriguing of the two. Not only because it is a rematch of last year’s compelling semi-final. These teams are also two of my favorite statistically because they both demonstrate the power of TSR. Both do a lot of things right and both result in the same thing: wins. Both teams outshoot their opponents regularly, Kansas City has a TSR of .55 and Portland has a TSR of .57. It doesn’t matter that they have slightly lower PDO or luck ratings, because of how they control the game. Since they consistently take more shots than their opponents it doesn’t matter that they both convert them below league average, because they also don’t let their opponents shot as much also. For both teams their TSR and PDO are fairly similar, Portland has a slight edge in both, but nothing here really distinguishes the two.

Looking at the season series, it would be easy to hand this weekend’s game to Portland, as they won the season series by a combined score of 10-3. It seems pretty clear then, put your money down on Portland and lets move on to the Sunday’s match up, right?

Not so fast. Looking at the underlying stats shows another story. Portland scored more than 3x as many goals as Kansas City, they should have substantially more shots, right? No. The numbers show a much closer season series. Portland has only taken 4 more shots then Kansas City throughout their series. The difference has been that Portland played extremely well in these 3 games, converting 41% of their shots on goal, which is almost double their season rate and their save percentage was at 80% which is 8% higher than their regular season rate.

Can Kansas City eliminate the mental mistakes and keep Allie Long away from the PK spot?

Can Kansas City eliminate the mental mistakes and keep Allie Long away from the PK spot?

What does this all mean? Well both of these numbers are highly volatile, which means they will most likely regress. While the shot ratio for the game is slightly in the favor of Portland, until the last game (the 7-1 Portland win), they were actually at .50 TSR at 25 to 25 shots taken/allowed. I have a very hard time picking between the two teams, for me it comes down to two main factors.

For Portland, a team with Christine Sinclar, Alex Morgan, Tobin Heath, and Allie Long, the key to winning this game is surprisingly their net minder Nadine Angerer. The current holder of the Ballon ‘dOr, you would expect her to be the elite goal keeper, and the Portland Thorns to have one of the best save percentages in the league. However, it is actually the opposite. Portland has a save percentage of 70.2%. To put this in perspective, Seattle has a save percentage nearly 12% better and only 2 teams have a worse one, Washington and Boston. However in the season series against Kansas City, Angerer has only given up 3 goals and has made 12 saves. The three goals allowed were a penalty, a shot where she was wrong footed by a deflection, and a golazo from about 10 yards. If Angerer continues her form against Kansas City, then I would give Portland the edge, however if instead we get the Angerer from the rest of the regular season I would give the edge to Kansas City.

Nadine_Angerer-4614

Will Angerer be what Portland needs to reach the final?

For Kansas City though, the key is limiting the mental errors. This may seem like an obvious ask, but this rings especially true for Kansas City against Portland. All year has Kansas City has only given up 32 goals, only 2 teams have allowed less goals. Almost a third of their goals allowed have been scored by Portland (10/32). A big part of this is mental errors committed. Many of these mental mistakes come from places you least expect, the hallmarks of how Kansas City plays, such as their energetic pressing and passing out of the back. Many of these mistakes have lead directly to goals. For example, all season Kansas City has only given up 5 penalties, however 2 of them were against Portland. Another example is in the third game, Kansas City failed to close down and mark Portland on short corners and twice Portland scored. What does it look like when Kansas City eliminates the mental mistakes? We know because in their second match-up Kansas City did exactly that and was able to win 1-0 at home. If Kansas City can keep their mental mistakes at a minimal and play a clean game, they have a good shot at winning.


Thank you for reading. And remember to tune into to ESPN2 at 1 pm ET to watch the game. If you have any comments be sure to either leave them below or tweet at me @huanandonly.

The Nadia Nadim Effect

Nadia Nadim’s story is a touching one. If you’re not familiar with her story, then I highly recommend that you click. Nadia Nadim’s arrival to the NWSL has not only made us aware of her journey and story, but also briefly revitalized Sky Blue FC’s play-off hopes, who are all but mathematically eliminated from the play-offs..

There is no doubt that Nadim, has had an impact on Sky Blue’s push. But exactly how much of an impact has she had. In six games Nadim has 7 goals and 3 assists, with a 1.27 nongoals per 90, 3 of those goals are counted as game winning goals (all stats are from the NWSL website).

A few weeks ago, on this blog I lamented about Sky Blue’s conversion rate of .192 among one of the league’s worse. With the question being, was the team unlucky, or was the low conversion rate directly related to personnel. On one hand the underlying statistics suggested that Sky Blue wasn’t playing that badly. With a TSR of .496 it showed that there weren’t getting out played and that they were actually holding their own. The problem was that the team had 16 points from 16 games, with an average of 1 point per game (hard math I know). Whether was luck, or personnel was to blame for the lack of goals, Sky Blue needed goals.

Can Nadim keep scoring? (picture via instagram)

Can Nadim keep scoring? (picture via Instagram)

With the arrival of Nadim though the team’s play hasn’t dramatically changed. In the 5 games that Nadim has started, the team’s underlying statistics haven’t changed. Their TSR is slightly higher at .503, showing that their position in the game hasn’t dramatically changed. In fact, Sky Blue has taken almost the same amount of shots. Before Nadim, the team averaged 12 shots per game. In the 5 games since Nadim has started, Sky Blue has taken 13.6 shots representing almost identical tallies. However in those 5 games the team has won 4 and lost 1. They’ve scored 12 goals in 5 games, where Nadim has not only scored 7 of those but has also assisted on another 3. To put that in perspective, the team in their previous 16 games had only scored 16 goals (16 seems to be the magic pre-Nadim number). Nadim has a personal conversation rate at a .58, the team is now converting at a .315. Correlation may not prove causation, but with very little changes in the team’s underlying stats you can almost definitely say: Nadim’s arrival has helped Sky Blue with what it needed most, goals.

All of this comes with a very large caveat, Nadim has only played in 5 games in the NWSL. Conversion rates, especially for individuals are particularly volatile, and there is no way that Nadim maintains a .58 conversion rate, which will fall to a more realistic number. The famous saying is form is temporary; class is permanent. It is going to be interesting to see what happens with Nadim, with 2 games left it wouldn’t be unimaginable for her form to continue or for the team to benefit from the extra attention that she draws to keep scoring goals. The question really is, how much of this is form and how much is Nadim herself. Yes, she has only scored 8 goals in 51 appearances for Denmark, but two of those were in the Algarve Cup knocking the US out of the tournament.

The real shame is that we probably will never know. Nadim most likely will be going back to Denmark after her loan, and most likely we will only see her again in a similar short loan, as she has hinted that she will continue to juggle soccer and her academic career in Denmark, where she is studying to be a doctor. Even though we might never know the answer, what we can definitely know, that Nadia Nadim almost single handedly pulled Sky Blue FC back into the NWSL play-off race.

Analytics from 7-4

It has been a month since my last analytics primer, so I thought that it would be a good time to write an update. That being said, if you don’t remember what all the stats and acronyms mean, again here is Richard Whittall’s primer again on the fancy stats. The rest of the stats should be fairly simple, saver percentage is how many shots on goal are saved, and conversion percentage is how many shots on goal are scored. Once again I’m going through the team’s underlying statistics and I’m going not only try to see where they point for the future, but I’m also going to look at how they’ve changed since May. Without further ado, the numbers:

Screen Shot 2014-07-11 at 11.08.55 AM

Tier 1: The Reigning Leaders

The Reign and FCKC are essentially in a league of their own when it comes to stats AND points. Their TSR aside from Portland is astronomically better then everyone else’s. Which shows that they’re dominating games, and the fact of the matter is right now they are both being rewarded from it.

1. Seattle

The news is not great for the rest of the league. Holding down first in the table are the Seattle Reign, we all know that they have not lost this year yet. Their GD is actually the sum of the Flash and Kansas City who respectively sit in 2nd and 3rd.

Looking at their underlying stats, the outlook is primarily the same. Their PDO is virtually the same, 1152, only slightly lower than it in May.  The easy answer is that their luck is going to run out. Their scoring conversion rate of 340 is well above the league average of 266. While their save percentage also rests above the league average as well. Historically these numbers will eventually drop to the league average, but who knows when that will be.

You could also say that their luck is of their own making. Their TSR is a full 10% higher than the league average. Their dominating games, taking significantly more shots than their opponents and turning these shots into goals. This is as close to a winning formula as you can get, would I be surprised if the team hits a cold streak or their luck turns? No. But so far this season the Reign’s PDO and TSR have been pretty consistent throughout the season so far.

One interesting stat of note is where the goals are coming from. If I told you that one of the Reign’s new signings scored 11 goals this year, you would assume that it would be Sydney Leroux. The goals though, are coming from Kim Little.

Can Kim Little keep scoring?

Can Kim Little keep scoring?

Who last year only scored 3 goals at Arsenal. One thing that the NWSL doesn’t keep track of is penalty goals, vs non-penalty goals so that could be a reason for the bump as Little is their designated penalty taker I believe.

The crazy fun ride for the Reign continues, while luck is seemingly on their side, they’re also doing their best to add to it.

2. FCKC

            Numbers never lie is one of my least favorite sayings. Stats are important but it is important which numbers you look at. In May FCKC sat in fourth with 12 points and they had also played 2 more games than the rest of the table, their PDO was also the lowest in the league while their TSR was the second highest. If you looked at just points and games played, than the future did not look very bright for them, if you looked at their PDO and TSR things didn’t look as bleak. All of this is my way of saying, numbers by themselves don’t matter, you need as much context as you can to put together a complete picture.

Looking at FCKC’s underlying stats now, they have lost a little of their TSR, but essentially with a .01 difference the number is the same. The biggest difference is their PDO. From a league low, mostly due to an increase in save percentage from Barnhart, it now sits at about league average. That means that while things may fluctuate, FCKC is sitting around where they are supposed to be.

Tier 2: The Manic Middle

Aside from Portland’s TSR high and Washington’s low TSR, nothing really separates these teams from one another greatly. Points wise they’re all within touching distance of each other, meaning that their TSRs and PDOs dictate what mathematically what should happen. But this groups mostly exemplifies that while we can try to predict what should happen, it could very well end up being something entirely different then what does happen.

3. Washington

            The stats for Washington aren’t great, they have a low TSR and a decently high PDO. They’re currently sitting in third. The good news for them is that they have games in hand on the rest of the league. But the fact that they have the league’s second highest PDO is not great. While they have a middle of the range save percentage, they lead the league in shot percentage.

This makes sense because while they are getting outshot by their opponents, only having a TSR of .44, the shots they are taking are going in more often. I personally haven’t watched many Spirit games this year but while the number is known to regress, it could be a situation of shot quality. It is definitely something to look closer at.

Does Mark Parson's know something we don't?

Does Mark Parson’s know something we don’t?

My gut feeling, especially after last year, is that it is just a hot streak for the team. Granted their numbers have been consistent for the year when I look back to May. While in hockey and other leagues shot quality hasn’t been something that has held up over time, who knows. Maybe Parsons has found the winning formula. Whatever the case may be, the Washington Spirit are a team I’m gonna be watching a lot closer as the year goes on.

4. Chicago Red Stars

The Red Stars are seemingly a story of statistics fulfilling their course. Their ranked 4th in TSR and 4th in PDO. Where are they currently sitting in the table? 4th. Their PDO has fallen slightly but surprisingly the stats haven’t seen a jump in the arrival of national teamer Christen Press. A striker of her quality, the only American to lead a foreign league in scoring, and their conversion rate is precisely the same as before her arrival.

While those that have watched the game have seen how she has influenced the game, be it through individual goal scoring efforts or defense splitting facts. I think its just a matter that she hasn’t been on the team long enough to make a meaningful impact on the team’s stats yet. While their PDO is a little high its nothing to be concerned about. They should be in and around the play-off hunt towards the end of the year.

5. Portland

One day Portland will get their whole team on the field. But the fact is that the league should not write them off, and should be very worried. Their TSR is third best in the league. Along with Seattle and FCKC they are really in a tier of their own in terms of TSR. They sit .07 away from their closest opponent in terms TSR.

Is something wrong with Nadine Angerer?

Is something wrong with Nadine Angerer?

From May the team has dropped in the table, this is easily explained. The team went from a very very average PDO of 1014 in May, to a league worse 907. Their conversion rate has remained very low, a league worse, something that you should expect to get better. Their save percentage is second worse in the league and has actually dropped more than 10 percent since May. This should be especially concerning because Angerer, the German goalkeeper and reigning Ballon D’or holder,was a such a big part of their off-season. Excepted to be a big improvement, over Blanc, Angerer has so far been worse, by saving 8% less shots on target than Blanc.

The trend though shouldn’t last. You expect a goalie of Angerer to recover and start keeping out more shots, you expect them to start converting more shots to goals, especially seeing as how they dominate the game. Much like FCKC got hot and made a run up the table, expect the same Portland.

6. WNYF

While the numbers may have been spot on for FCKC, they were considerably more murkey when it comes to WNYF. The numbers for the Flash are considerably average. Their TSR is basically the same and their PDO which has dropped a little was really not that high to begin with. They’ve moved one spot up since May, but their underlying stats are the same and not particularly encouraging. When your PDO is the third highest in the league and you are sitting at 6 in the table, things don’t particularly look good.

On a positive note their TSR has improved since May, but is still only good enough for 6th in the league. The thing is though, they have kept themselves in the hunt. Currently as of July 4th, they are only 3 points behind the Spirit who sit in third. Anything can happen, and while luck isn’t exactly on their side, given their recent history you can’t really put it past them to defy the stats and make a late run.

Tier 3: The Bottom

The bottom 3 right now represent a tier unto themselves. Points wise, they are not one game within touching distance of the next tier. Aside from Sky Blue, you really can’t see any of them really making it out of this group and challenging the rest of the league.

7. Sky Blue FC

Last year the team had a very good TSR, they made the play-offs and lost in the first round. This year it seems as if they would be happy just to be in the play-off hunt.  The underlying stats for Sky Blue don’t look particularly very encouraging or good.  Their TSR has gone from .51 to .49. While this isn’t a dramatic shift it does show that they are starting to lose control of games that they once held, last year they held the league’s 3rd highest TSR.

They have the league’s 3rd lowest PDO, which indicates that things should be turning their way. However last time I posited that their low conversion rate, could be related to a dearth of proven goal scoring ability at the forward position. Their PDO hasn’t really changed since May, so perhaps they can move out of the bottom tier of teams, get hot and make a run at a play-off spot, out of the bottom 3 teams, they’re really the only one that you could foresee a turn around for. 

8. Houston Dash

Everything about the Houston Dash is new, except their stadium and broadcasting set up. The team is making the types of strides that you would expect them to be very happy with. Their TSR is up 6% from May. Their conversion rate and PDO have gone up, but some of that seems to be of their own making by now getting control of the game more. Their PDO, now slightly above a league average at 1029, shows that the breaks are going in their direction (mainly when it comes to converting shots to goals), so you can’t really expect much more from the team. That being said their TSR is still very very low and you can’t really expect them to really make a run from here. That being said the signs are encouraging for the team. The fact that their TSR is going up shows that they are starting to have more control of games. While the signs aren’t pointing to a play-off run, they are trending towards improvement. They’re probably going to stay at the bottom or near the bottom but their soccer is improving.

9. Boston Breakers

In May when I looked at the stats, I predicted that hopefully for Boston their luck would turn. The bad news that their luck has turned, but for the worst. Boston’s PDO went from 957 to 921. Their save percentage has dropped slightly and their conversion rate have also slightly dropped as well. Much like with Sky Blue, yes both of these numbers tend to regress to the mean, but you also have to wonder about the talent that is creating these numbers.

The good news is that their numbers are also trending upwards. Their TSR indicates that they’re taking more shots, which means that they are doing the right things. Their PDO should come up, indicating a turn of luck. They’re due to start both stopping more goals AND converting more shots to goals. Both of which would hopefully help them move past Houston. Last time while both Houston and Boston were due some luck, it seems that only Houston’s has really gotten better. Hopefully the same happens for Boston and their TSR slowly climbs up as well.

TL:DR

Sorry again for the wall of text, but something I believe is that numbers themselves, mean nothing and that context is king. Thanks for reading, if you have any questions let me know and feel free to tweet at me @huanandonly. Thanks again and hope you enjoyed!

NWSL Advanced Stats 5-23-14:

Believe it or not, we have concluded about a third of the 2nd NWSL season. Because of the odd number of teams we have an inconsistent number of games played. Kansas City leads the league with 10 games played, while Boston brings up the rear having played only 6. That being said, the point of this post isn’t to complain about scheduling, that is for another day, but to look at some of the underlying statistics and analytics of the teams so far.

Just like I’ve done in my previous piece I’m going to focus on the respective team’s PDO and TSR. For those of you that need a refresher or want to learn what or why these statistics are important, here is a great primer by Richard Whittall. For an even quicker primer, PDO measures a team’s luck and TSR measures how well a team controls the game through shots rather than mere possession. Each stat gives different insight into not only how the team has been playing, but also gives a glimpse into what may happen for teams as well. I’ll go through the table and try to explain what each number means. Without further ado: the numbers.

Analytical Stats Table

PDO as of 5-23-14TSR as of 5-23-14

Seattle Reign:

The Seattle Reign have dominated the league so far. Their tie against Kansas City represents their first dropped points through 8 games. They’ve scored 17 goals and only given up 5 goals. Even scarier is that a few of those goals are from penalties meaning that scoring on them from open play is a tough task. Their underlying statistics give the rest of the league some good and bad news. First with the bad news, they dominate the games as much as we thought if not more. If you don’t know why you should be worried, Dan Lauletta wrote a piece for the Equalizer which you can read here. Looking at their TSR, they lead the league with a TSR or .63, meaning that they are outshooting their opponent 2-1. What this means is that they aren’t just outscoring their opponents but also outshooting the game and controlling the game with their shots as well.

The good news for the rest of the league is their PDO is quite high. They lead the the league with a PDO of 1187. Their shooting percentage is high, what is really boosting their PDO is their save percentage. While they have allowed the least amount of shots on goal all season (30) they’ve also saved all but 4 of those (some of you might wonder how they gave up 5 goals? One of the stadiums does not count which penalties as a shot on goal or a save). That being said, their PDO will have to regress, meaning that either they will start giving up more goals (more likely) or stop converting shots on target to goals at as high a rate (their conversion rate is high but not out of league norms). That being said if they continue dominating the games and keep their TSR they might just keep winning games but simply ship more goals.


Portland Thorns:

Staying in Cascadia, 2nd in the points total is Portland Thorns. Outside of the stats this is bad because the team is still awaiting the return of Alex Morgan and Tobin Heath. Portland is third in TSR behind Seattle and Kansas City. That said their PDO is currently at 1014. What this means is that their luck has gone both ways, meaning that they should be able to maintain their form as is since they aren’t saving a crazy amount of shots on goal, or converting shots on target to goals at a crazy rate either. In fact they are actually converting shots at a league low .176%. Meaning that their team is creating chances and just not converting. While you expect their save percentage may drop, with the return of Morgan and Heath, you can only expect them to start converting more shots on target to goals. Expect them to mount a challenge on the Seattle Reign.


Chicago Red Stars:

The Chicago Red Stars are surprising people who are looking at the table right now. Last year the team finished 6th and their underlying statistics didn’t suggest anything different was going to happen this year. Their PDO is the third highest in the league right now, but that being said at 1089 it is not out of this world, but it means that some of their luck should regress slightly. Their TSR of .53 is good enough for 4th in the league and makes them above average. That being said looking at the team’s schedule, they have played the hapless bottom of the league Boston Breakers twice, the only games where they scored multiple goals. Look for the Chicago Red Stars to regress slightly but stay in the play-off hunt for the rest of the year.


FC Kansas City:

Kansas City is in an interesting position, looking that the table they have played 2 to 4 more games than the rest of the competition. However that being said, looking at their TSR and PDO they should be doing better. Kansas City is 2nd in the league in TSR, with a rating of .60. Which is only slightly behind that of the Seattle. Picking up from last year it seems that they are still dominating the game like they did last year. You can see this as they had the exciting 2-3 loss to Seattle and are the only team to take points from Seattle this year (even though it was a 1-1 tie). Anyone who saw those two games saw that they have the quality to stand with the best in the league.

The main difference being that so far this year they have been substantially unluckier. They have a PDO of 878 which is absurdly low. That means that Kansas City will almost undoubtedly move up the table. Breaking down the PDO further, they are in the bottom half in shot percentage. The problem for them is really their save percentage where they are tied for last in the league. Meaning right now Nicole Barnhardt is only saving .653% of shots on target. That is something that you expect to turn around sometime this season. Look for Kansas City to start turning some results their way, stop conceding so many goals and move their way out of the play-off hunt.


Western New York Flash:

Sitting in 5th Western New York are the current holders of the inaugural Championship. Looking at their stats though, their chances of repeating are unlikely. Right now they have not only 2nd highest PDO at 1091 but they are also getting outshot by opponents right now with their TSR resting at .49 which places them around 5th. This means that the team has been pretty lucky in their games so far, they have not been in control of their games being outshot by their opponents. Their save percentage isn’t extremely high but they are 2nd in the league in shooting percentage, which will most likely regress.

The good news for them is that the stats don’t tell their whole story. Western New York lost Abby Wambach for 2 games due to her broken ocular bone, and missed Carli Lloyd for 2 games due to suspension. For their sake you hope with players of those caliber returning to the line up for a more extended run their underlying statistics will improve, and perhaps even their teams fortune. But unless their underlying statistics begin to improve they will most likely begin the slide down the table.


Washington Spirit:

Sitting at 6th in the league, last year’s bottom feeders seem like they were able to turn their team around with the notable additions of Yael Averbuch and Crystal Dunn. Their TSR at .43 shows that they are nothing to really be scared of, but represents a marked improvement from last year where they were last in the league rocking around a .35. The main difference being their PDO. While their 1076 is nothing to be extremely alarmed about, their shot percentage at .389 is something to be alarmed at. It means that the Spirit are converting about .4 of their shots on target into goals. Not only is this rate unsustainable, but when combined with the fact that their being outshot for most of these games, look for the team to either to stay in 6th or regress slightly.


Sky Blue FC:

Last year, Sky Blue finished 4th in the league and lead the league in TSR. This year they have hung around the bottom, unable to score goals. Despite a near even TSR of .51 Sky Blue is currently sitting in 7th right now. The main culprit being the league’s 2nd lowest PDO at 923. The bad news is though much like the Chicago Red Stars they have played the bottom feeder Boston Breakers twice. And while dominating those games helped their underlying statistics, they were unable to convert that into points. Speaking of conversion, their .200% shooting percentage is also 2nd lowest in the league. You can expect that if they can start converting these shots on target into goals, they can start getting more points. The problem being that the team itself doesn’t have an elite finisher. While on one hand you expect their luck to turn on converting shots to goals, maybe their low conversion rate is more about the quality of their strikers than the luck.


Houston Dash:

The new kid on the block, the team has the had bad luck. Losing their number 1 expansion draft pick to an ACL injury, they are also rocking the league’s third lowest PDO, 929, which hopefully means that their luck will turn. They have the league’s 2nd lowest conversion rate at .179.

On the flip side of that coin is their TSR. A paltry .31 their TSR is a league worse. So not only are they not very efficient at converting shots on target to goals, they aren’t taking nearly enough shots and are being grossly outshot as well. The underlying statistics point to that a few more breaks should go their way this year, they aren’t creating enough opportunities for breaks to go their way.


Boston Breakers:

Last year Boston hovered right outside the play-off spot, this year after the trade of Sydney LeRoux, the team sits at the bottom of the table. With one win to their name, their underlying statistics are only slightly better than that of Houston. Their PDO is 957 and their TSR is .35. What is really hurting Boston is their tied for league lowest save percentage. Which you would expect to rise to meet their slightly above average shooting percentage. While Houston is having a problem converting shots to goals, Boston is having a problem making saves.

Seemingly they should overtake Houston eventually, but these numbers are indicators of trends not rock solid signs of the future. That being said the return of Kristie Mewis to the line up full time should help the team. Much like their Houston, their PDO gives slight hope to improvement and indicate that a few more breaks should go their way, their TSR dampens that optimism.

TL:DR:

Looking at the statistics, everything on the table is seemingly as it should be. I wouldn’t be surprised if Kansas City caught hot and were able to pull of a few wins in a row, and I also wouldn’t be surprised if Seattle maintained their current goal scoring form, but we started seeing more cracks in their defense. On the other side of the table, the underlying stats show how much the bottom two teams have been dominated so far. Like I’ve said before, these numbers are not merely indicators of things that are likely to happen, are not written in stone. I look forward to seeing how statistics and the predications hold up for the season. If you like what you read, leave a comment or send us an email. Thanks for reading.

Western New York 1:1 Portland Thorns


Two things I wanna start off with. First sorry for missing last week. To my ten readers I hope you made it through the week without my analysis, if you did not then sadly I am most likely back to the single digits when it comes to readers. But for those of you that stuck with me, there will most likely be an extra post this week looking at the some of the more advanced statistics of the NWSL season so far.

Secondly this blog post will be sadly missing pictures that have so far been a staple of these posts. The reason being that the Youtube footage that provides the pictures usually is no longer online. So while I was able to review it, I was not able to take down some pictures. That being said so you don’t have to read a wall of text, this post will be a little shorter.

Summary:

The rematch of the inaugural NWSL Championship game was slated to be an exciting one. Goals were expected as you had Abby Wombach and Christine Sinclair as the marquee match up. However both teams worked hard to limit the two striker’s chances. The big way that this was done was congesting the middle.

In today’s modern game, more space is going to be found on the flanks. As teams move to protect the middle with bodies and people, room is opened up out wide for players. That is why you see a lot of strikers drift out side for the ball, because that is where they can safely receive the ball. For example if you look at my last recap Boston Breaker’s Lisa DiVanna was often seen receiving the ball on the flanks. This is because that is where the space is.

Damned if you do:

For most of the game, the two teams canceled each other out. The goals themselves had a few things in common, that being they were created by open crosses. On both plays the ball is sent in from wide and the defender or goalie are forced into a mistake because of the quality of the ball.

Looking at the Western New York goal, the ball is crossed in from out wide. As the Western New York striker takes it, the Portland defense is instantly on their heals. Even though it is still a 2 v 1 situation, the Western New York striker is able to cut the ball by one defender taking her out of the play. She then forces the second defender to defend her 1v1. She then makes a move to go around her marker. The Portland defender knowing that she has no help is forced to foul to prevent a break away with the goalie. The free kick is pocketed top corner and Western New York take the lead.

What causes this whole chain of events is the fact that Portland left the flank open for the Western New York player to receive that ball. With time and space the fullback is forced to come out and defend her, the problem was the full back, previously narrow to help congest the middle, has too much space to make up. Portland played narrow not to let any plays develop through the middle, however when the ball went out wide, the defense became stretched leaving the central defenders on an island.

Damned if you don’t:

On the Portland goal, the immediate culprit is is the goalie for giving up the rebound. It is hard to argue against that, the ball is muffed by the goalie and a Portland attacker is quick to pounce on it and tap it into essentially what was an open goal. It seems simple to blame Western New York’s goalie, and on some level you can, but that doesn’t tell the whole story.

Much like the Western New York goal, the chain of events was caused by the space on the flanks. While Portland tried to close down on the ball out wide, Western New York didn’t, giving Portland time to tee up a perfect cross. One of the reasons the goalie fumbles it is because the quality of the ball delivered. The ball goes over the Western New York defender who tries to clear the ball, and dips right in front of the goalie, making it look much easier than it actual was to hold on to the ball.

Conclusion:

As more teams try to stuff the middle and force the play out wide, it is going to be interesting to see how they deal with the play once it is out on the flanks. In week 2 we saw Houston try to shift as a unit to contain the play, but they also gave up 2 goals one of which came from a Heather O’Reilly cross. This week we saw another two strategies. Closing the player down out wide once they receive the ball, and trying to stay compact once they have.

Right now it seems that the problem is that the player can’t receive the ball in space. That if the player gets the ball it is already too late. Teams are going to have to figure this out how to deal with it if their game plan is to keep packing the middle of the field, and clogging the midfield. Tactically it will be interesting to see how teams not only defend the space on the flank, but attack it as well.


Boston Breakers 2:3 Houston Dash

In a game that saw the Dash get their first win in franchise history, it also saw the Boston Breakers remain at the bottom of the table, looking for their first win. While Boston was dominated last week in their defeat to Seattle, this time while a draw was probably a more fair result, the Dash left Boston with three valuable points.

Don’t let the score deceive you. While there may have been five goals between the two teams, tactically the two coaches could walk away knowing they did all they could. The team’s conflicting systems for the most part canceled each other out. Which made for tactically a uneventful game. Houston let Boston have the flanks, and Boston let Houston have the center of the pitch. The goals instead came from individual errors. Three of the goals could have been prevented from surer hands from Houston and Boston’s goalies, while a fourth from a bad foul from a Boston defender.

Formation:

Both sides came out in a 4-3-3, what this game showcased was the versatility of how the 4-3-3 can be deployed. Houston for example was a more compact. Their central three stayed close together, with two central midfielders and third midfielder sitting behind the two. Essentially they packed the midfield space and forcing Boston to utilize the flanks. With the dominance of the midfield space, Houston looked to play more through the middle of the field.

For Boston, the 4-3-3 was fueled by the flanks and runs from midfield. When Boston traded away Sydney Leroux in the off-season they traded away 11 goals. Boston this year is deploying Lisa De Vanna as their sole striker. While De Vanna scored 5 goals for Sky Blue last year, she is a different kind of striker, not as powerful as Leroux, she drifts out wide more. The problem was even though De Vanna was often able to receive the ball in space, she also left a large amount of space behind. Boston relies then on people making runs into the space that she leaves behind. While for Houston the third midfielder sat behind the other two, for Boston the third midfielder was in front of the central two, looking to make runs in.

Space Key:

De Vanna is seemingly the catalyst of Boston’s attack. Yes, Boston relies on Heather O’Reilly’s play on the flanks to create chances, but much like for the US National team, you know what you’re gonna from O’Reilly. Speed down the flanks, good service, and occasionally more central runs. With De Vanna, it is more up in the air. When the Breakers are on the same page as De Vanna it leads to dangerous opportunities. When someone comes in late to the space it leads to goal scoring chances.

You can see number 9 O'Reilly is able to use her speed to not only occupy the space that De Vanna left, but to get behind the defense as well

You can see number 9 O’Reilly is able to use her speed to not only occupy the space that De Vanna left, but to get behind the defense as well

For example the first goal was a result of an in-cutting occupying the space that De Vanna vacated. As you can see De Vanna, in blue, has dropped into space for the ball. As she turns, number 9 O’Reilly is curling into space and makes a run that leads to the goal. More often though this space was left vacant, instead Boston often was relegated to the flanks.

This space on the flanks for Boston was seemingly by design. Boston took advantage of the space that Houston left open for them on the flanks. However they could only really capitalize on it once. The problem was that when De Vanna drifted into space, the only person there was a midfielder or winger making a run in which was often picked up. The one time Boston scored was when Boston’s Lohman was left unmarked from her midfield run as the Breaker’s Heather O’Reilly served in the ball from the flank.

While De Vanna is able to not only get the ball at her feet, you can see that no one is in Zone 14

While De Vanna is able to not only get the ball at her feet, you can see that no one is in Zone 14

Here on the set up of Boston’s 2nd goal, you can see how deep and wide De Vanna has to drop to get the ball at her feet. For Houston, in orange, this is exactly what they want, the play is in front of them and there is no one really attacking them or the space behind them. The problem is they go to sleep as Joanna Lohman makes her run through the defense, while McCloud doesn’t do a good job of coming out and claiming the ball.

Packing it in:

When Boston had the ball on the flank though, did their best to make sure that it stayed there. For example while Sky Blue last week used their flanks to play a diagonal ball onto the straight run from Maya Hayes at striker, Houston didn’t let that happen. Boston’s only play from the flanks was either a long change of field or to serve the ball into box. Houston did a good job of not only keeping their three compact but also moving as a unit.

Here you can see that Houston not only has 9 players behind the ball but also how congested they make the field

Here you can see that Houston not only has 9 players behind the ball but also how congested they make the field

In this shot, early in the game, Boston has the ball in the middle of the field. In this one shot though, you can see nine Dash players in the shot. Effectively jamming the midfield and making sure that there are not only no easy passing lanes but no space for the Boston ball carrier to operate in as the Dash players close in on the ball.

The team's tendency to clump together leads to a vulnerability to quick counters.

The team’s tendency to clump together leads to a vulnerability to quick counters.

However, in this shot you see the downside of the packed middle. If teams are able to find a seem quickly, there is tons of space on the other side. Here you see De Vanna is able to play a quick outlet through the defense, exposing the tons of space behind Houston. This play quickly develops into a track meet as the ball is played to an on running fullback.

As the play develops, Boston is now able to play it into space and attack that space

As the play develops, Boston is now able to play it into space and attack that space

Once Boston is able to play it through the midfield, Houston is forced to recover. In this shot you can see the players scramble to get back in position. As a new team this is going to be a problem, their unfamiliarity with each other means that they are going to find themselves in trouble from time to time. For the most part it seemed to work, however this is the danger that Houston is going to have to deal with if they keep playing this way.

Conclusion:

The game was even for the most part. It will be interesting to see how both teams continue to develop. Boston has seemingly gone from a mid-table team, right out side of the play-off spot; to a team with zero points after two games and two tough losses. Houston though has shown they are going to be tough to play while stuffing the midfield. Holding the Portland Thorns high powered attack to 1 goal and were unlucky to come away with a point in that game, while stealing three points from Boston. Tactically as the team gels, I would not be surprised if by the end of the year we see Houston hanging around 5th with a chance to make the play offs.


Sky Blue FC 1-1 FC Kansas City

The short summary of this game is that Kansas City attacked while Sky Blue defended. Kansas City not only scored first, but dominated possession while Sky Blue looked to defend and hit Kansas City on the counter. The two team’s contrasting styles canceled out, leading to a pretty quiet game over all, with the majority of chances coming for Kansas City.

Formation:

Kansas City continued with their 4-4-2 diamond that they saw success with last year. Sky Blue came out in what appeared to be a 4-2-3-1. More intriguing than the formation was how Sky Blue where the players were deployed. Playing both left-footed Kelley O’Hara and Kendall Johnson at fullback, Kelley O’Hara played on the right, acting almost as a inverted fullback. Ahead of her was the young Australian fullback, Caitlin Foord, playing in the midfield. It will be interesting to see if Sky Blue keeps this deployment or if in the future Foord drops to the backline and either Johnson or O’Hara move out into the midfield.

While this off-season many people wondered if they would revert back to the 4-3-3 or 4-4-2 over the off-season. There were concerns this off-season if Amy Rodriguez would be able to play as the sole center forward in their preferred 4-3-3. But it seems that with Amy Rodriguez, Kansas City has stuck with the 4-4-2 for now.

Pressing Concerns:

Both of these teams are teams that want to force mistakes when their opponents have possession of the ball. How the teams pressed each other, really shows how they approached the game differently. Kansas City played more of an organized pressing system, akin to Barcelona, Looking to win possession and then keep the ball. On the other hand Sky Blue pressed to create attacking chances, using their press to quickly transition to direct counter attacks.

Kansas City’s pressure was based on shape. What that meant is that while one player stepped in to pressure the ball, the other defenders looked to block the passing lanes looking to intercept a bad pass. But rarely did they commit more than one person to the ball, looking to force a mistake in possession or Sky Blue to send the ball deep.

Kansas City Structured Pressing:

When Kansas City retrieves possession, they immediately are able to keep possession because of the players defending the passing lames immediately becoming passing options. They maintain their spacing and structure.

Like Barcelona, the ball is the ultimate prize. Theoretically, they can’t be hurt when they have the ball, so immediately after losing it they try to win it back. On the other hand once they have the prize, there’s no reason for them to waste possession. Their structure then helps them both in offense and defense. Getting the ball back is enough, it doesn’t matter if the ball is sent deep or they win it in a tackle. Getting the ball back is success enough. That is why it is important for the team to work as a unit.

 Image

For example here you see Tymrak pressuring Katy Freels. Kansas City had just lost the ball and are quickly trying to get it back. The other three Kansas City defenders sit in passing lanes, preventing an easy outlet. Kansas City does a good job of using the sideline as a defender, Freels has no options to her right or in front of her. She is in turn forced to either play a blind back pass to Johnson, turn in possession, or play the ball out. Kansas City presses trying to strangle an opponent.

Image

Freels here decides to turn putting her back to Tymrak. Tymrak recognizes that Freels is now the pressing “responsibility” of Amy Rodriguez and drops into space. While Freels ends of blindly clearing the ball, where the ball is retrieved by the Kansas City defense, you can see that the Kansas City attackers are all anticipating the ball coming to them. They’re all watching the ball, trying to win possession back each player with their own responsibility in the action.

Sky Blue Chaos Theory:

On the other hand, Sky Blue’s pressure is more of a swarm mentality. They don’t maintain shape as well in their pressing. Instead they want to win the ball back with a tackle, so they can quickly counter from possession. Sky Blue didn’t do a lot of pressing in their opponents half, ceding that half. However once, Kansas City got the ball into their final third, Sky Blue crashed the ball hoping to win the ball back to trigger a quick counter.

 Image

For example here, as Kansas City enters the final third, you can see 4 Sky Blue players moving towards the ball, with two of them trying to make the quick tackle. However, just outside of the shot on the right, is a Kansas City player making a run for the quick outlet for the ball. This was not atypical, because so many people are committed to attacking the ball carrier, Kansas City was able to keep possession with quick outlets and switching the field. Sky Blue is doubly relying on their player’s athleticism. They need it to press the ball, but also to recover quickly and get back into position after committing to the ball.

Image

Here you see the scramble after a swarm. There is acres of space for Kansas City to run into.What ends up happening is that there were a lot of 1 on 1 situations for Kansas City, where Sky Blue defenders were forced to attempt to hold up play waiting for help. Kansas City though, didn’t really take advantage of these, often they were instead too patient with the ball. Holding it in space waiting for passes to develop and trying to keep the ball rather than push their advantage.

Amy Rodriguez:

While many people questioned how Rodriguez’s athleticism would translate to the structured system that Kansas City played previously. Kansas City showed that she added a wrinkle to their system, but didn’t overhaul it. What Rodriguez provided was another option. Against teams that press and as dramatically as Sky Blue, Rodriguez provided a more direct option. Lauren Holiday moved a little bit deep and farther from the goal, seemingly more content to send through balls than receive them.

Rodriguez’s speed created chances, though she only put one of them away, you can only expect her to get sharper after a year off. Her speed and work rate also helps in pressing the ball and winning it back quickly. Even though Kansas City can’t play their 4-3-3 with her, she helps their system more overall. Formation isn’t how a team plays, but only how its set up. While Kansas City is not playing a 4-4-2, Amy Rodriguez allows them to play their possession and pressing system more effectively.

Conclusion:

Sky Blue was lucky to come away with a draw, only putting two shots on goal, both from Katy Freels. However you can only expect the two teams to get better at what they do as the season goes on. Perhaps the return Christie Rampone, will add a little bit more organization to their fast pressing system. Lloyden also looked shaky with the ball at her feet, perhaps why they looked to be aggressive with the ball. Sky Blue’s goal from an off-side’s by Kansas City had a total of 5 passes before the ball hit the net.

But Sky Blue is playing with fire, yes they were very efficient, but last year they dominated the shot count. They lead the league in TSR, consistently out shooting their opponents. This week they were out shot 14-5. And on another night where Amy Rodriguez is more clinical, they lose this game by a wide margin.


NWSL Analytics Part I

As the National Women’s Soccer League (NWSL) rosters start to settle and national teams return from abroad to their club teams, it is time to look forward to the upcoming 2014 season. Before comparing off-season moves and “sexy” off-season talk, it is important to look at some underlying statistics from the 2013 season.

For this post, I’m going to focus Total Shot Ration (TSR). If this concept sounds foreign to you, I suggest you read this quick summary of this stat from Richard Whittall and Ted Knutson. I recommend Whittall for the more uninitiated, but both are very accessible.

If clicking links or opening a new tab is strenuous for you, then I will give you a basic breakdown of the idea behind the statistic. TSR is the ratio of shots for divided shots for + shots against. While possession is in many ways a toothless stat, the idea behind TSR is that the amount of shots you take and give up show how much you are able to control the game. TSR matters because of the strong correlation between TSR and points/position.

Screen Shot 2014-03-23 at 6.26.47 PM

Illustration 1: From the chart you can see that there is definitely a correlation between a TSR and Points gained over the season. However with the small sample size of only one season and 8 teams, the sample size is too small. So even while the correlation isn’t as strong as other leagues, you can see that it exists.

For now, only time will tell if TSR is as reliable an indicator as it is in other leagues. Some analysis, has shown that in unbalanced leagues, such as the MLS, that the correlation between points and TSR isn’t as strong. Once there are more matches and seasons to look at we will see if TSR applis to the NWSL. Right now since the NWSL was a competitively balanced schedule (each of the 8 teams played each other 3 times), I will assume that the value of TSR can be applied to the NWSL.

In a league where the top-3 playoff teams were only separated by goal differential, and the fourth playoff sat only 2 points back, TSR doesn’t reveal that much. In fact you can say that what the TSR does show is how close the league actually was. With the exception of Seattle to some extent and Washington to a much higher extent, the TSR’s are actually pretty close together.

Illustration 2: The shot statistics are from the NWSL official website. The possible problem with these numbers is where they came from. While the NWSL does not tell us where the numbers come from, it is most likely true that they depended on the home scorekeeper to supply the numbers. Meaning there isn't a consistent standard for the numbers themselves.

Illustration 2: The shot statistics are from the NWSL official website. The possible problem with these numbers is where they came from. While the NWSL does not tell us where the numbers come from, it is most likely true that they depended on the home scorekeeper to supply the numbers. Meaning there isn’t a consistent standard for the numbers themselves.


One thing that is interesting is that Sky Blue who finished in fourth lead the league in TSR. They did lead the league for the majority of the season, they lost a lot of steam towards the end of the season due to injuries. While not a lot of people are talking about them, underlying statistics look good for the team. They’re returning many of the core nucleus and getting a healthy Kelley O’Hara back, so they could be someone to look out for.

While TSR is a good predictor of regular season success, it does not really mean anything in a one off game. With the many moves in the off-season along with players coming back from Europe in the middle of the season, TSR may not mean as much in the NWSL as it would in other more stable leagues such as the European leagues. For example the return of Megan Rapinoe or Tobin Heath mid-season could have had a big impact a team’s underlying statistic. Added to instability of the TSR is the addition of an expansion team to the fold. It will be interesting to see how the numbers hold up going into the NWSL’s 2nd season and if they hold any significant meaning or predictive ability.

Per usual if you have anymore questions. You can email us at threequartistas@gmail.com or leave us a comment in the comment section.